Instance metrics
Customers see how their servers perform on each server's Monitoring tab in the client portal: CPU, memory, network traffic, disk operations and disk throughput, over the last 5 minutes, 24 hours or week. OSIE reads these metrics in each region from one source, either the OpenStack metric service (Gnocchi) or a Prometheus server. A region without a source shows no charts.
Choose a region's metrics source
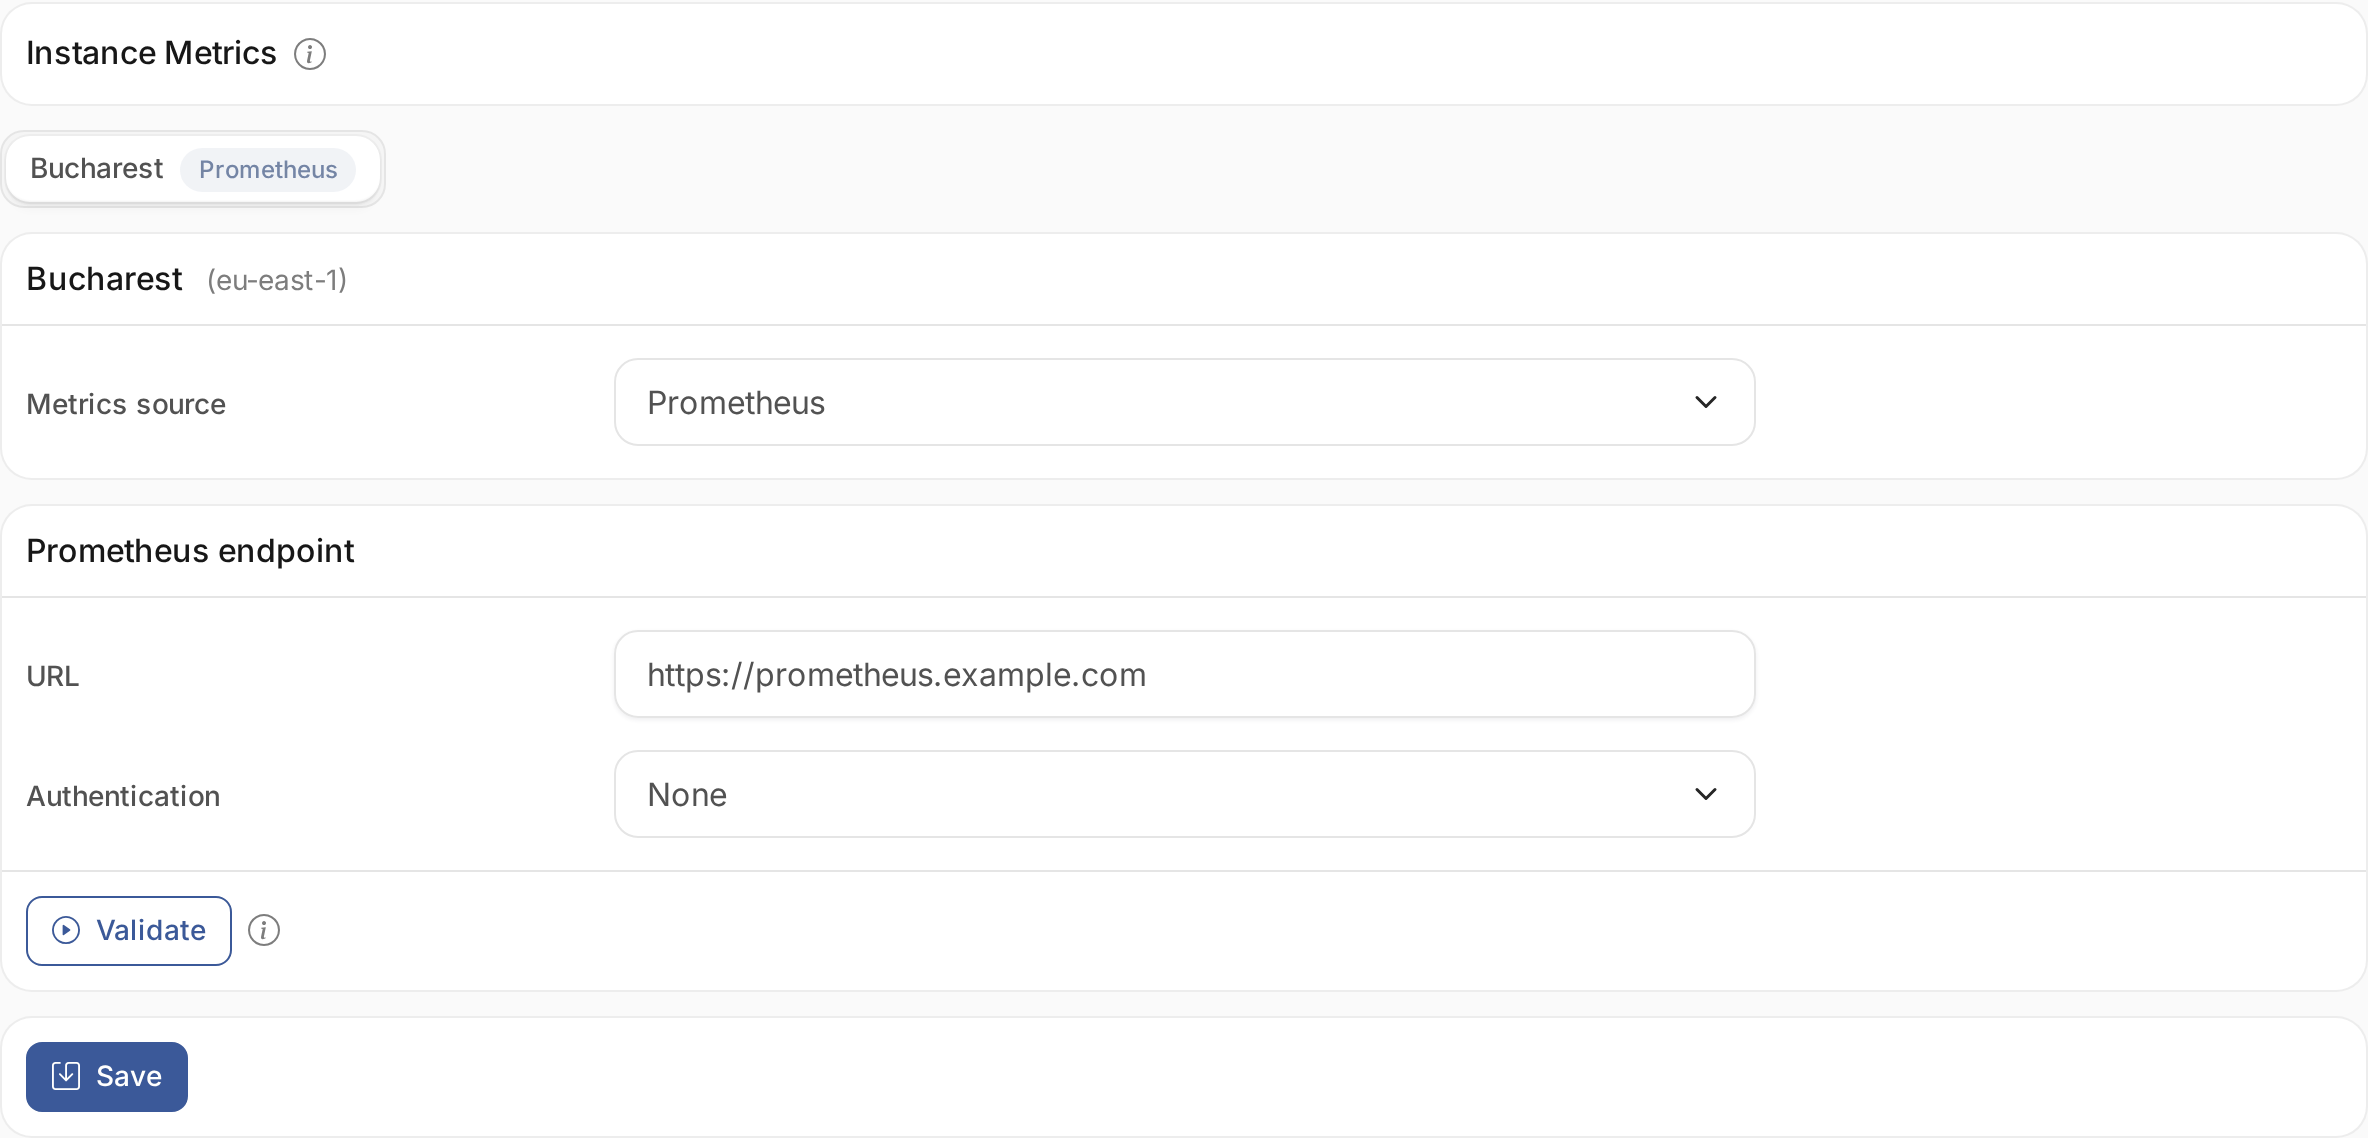
- Go to System > Service providers, open the cloud, and choose the Instance Metrics tab.
- For each region, choose the Metrics source: Gnocchi, Prometheus or Disabled.
- Select Save. Each region is saved on its own.
Until you choose a source, a region uses Gnocchi when its metric service is enabled on the cloud's Services tab, and shows no charts otherwise. Cloud diagnostics check that each region's source answers.
Read metrics from Prometheus
Use Prometheus when the cloud has no metric service, or when you already collect server metrics with Prometheus exporters.
- Enter the Prometheus URL, and choose its Authentication: None, Basic with a username and password, or a Bearer token.
- Select Validate. OSIE probes the server, detects how its metrics are labelled, and reports the exporters it finds and whether each returns data.
- Under Exporter per dimension, check which exporter feeds each chart: CPU, memory, network, disk operations and disk throughput. Validation preselects the exporters that returned data.
- Select Save.
OSIE stores the password or token encrypted. To keep the stored one when you change other settings, leave the field empty. The OSIE API must reach the Prometheus server, as listed in Network flows and ports.