VMware to OpenStack: Can Your Dashboard Handle Scale?
Migrating from VMware to OpenStack requires detailed planning. You plan the architecture. You map the workloads. You manage the transition. And at the tail end of the migration, you expect an out-of-the-box, enterprise-ready dashboard.
OpenStack’s answer is Horizon, its default dashboard. This is your vSphere Client equivalent.
Horizon provides a GUI to interact with OpenStack services: storage, images, identity, and compute. If you’re coming from VMware, these map closely to what you already know. The terminology is different, the functionality largely isn’t.
While Horizon works well for small workloads, performance degrades fast at scale.
Enter Osie.
Osie extends Horizon to provide a customer-ready OpenStack dashboard. It performs well under load.
In a previous blog, we explored why that is architecturally.
We now have the data to prove it.
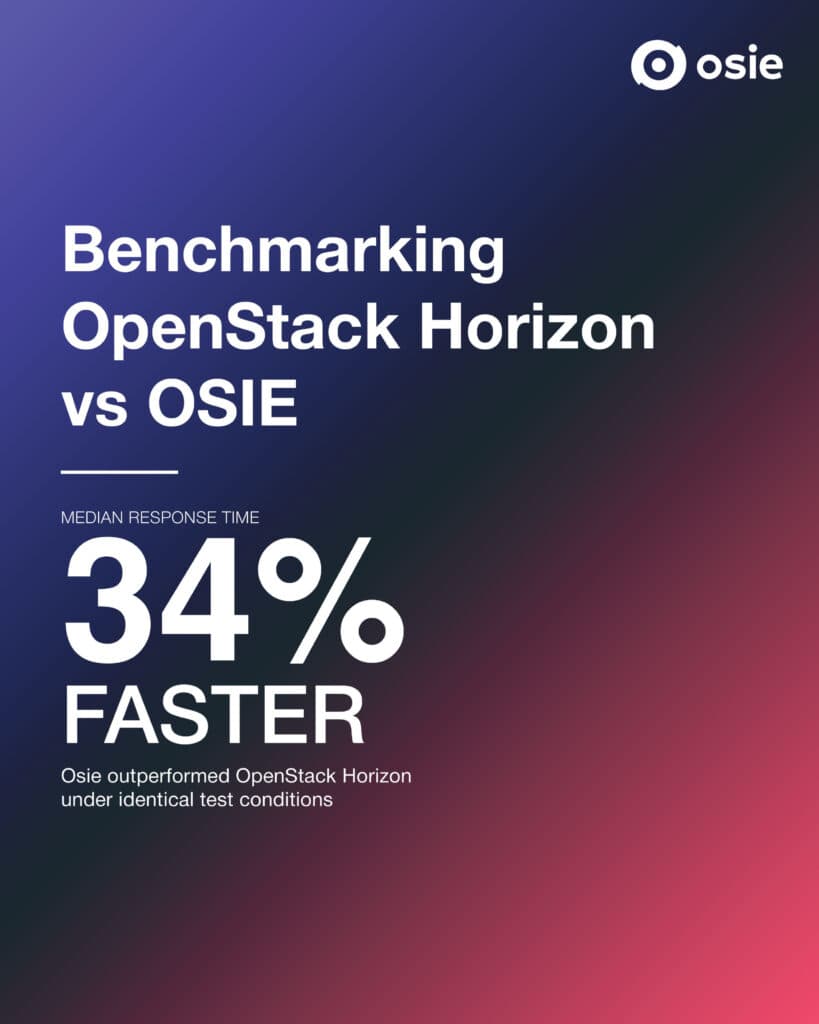
Benchmarking OpenStack Horizon vs OSIE: A Head-to-Head Performance Test
We tested OpenStack Horizon against Osie under identical conditions. Same tool. Same load. Same infrastructure.
The results were clear: OSIE was 34% faster on median response time. The reason is architectural, not hardware.
The Benchmark: 1 Instance, 100 Concurrent Users
We ran load tests against both dashboards using Locust.
Both environments used the smallest available flavor on each platform. OSIE’s minimum (smi.1c-2g) is larger than Horizon’s m1.tiny (512MB RAM). That reflects platform defaults, not test bias. The instance specs don’t affect dashboard performance.
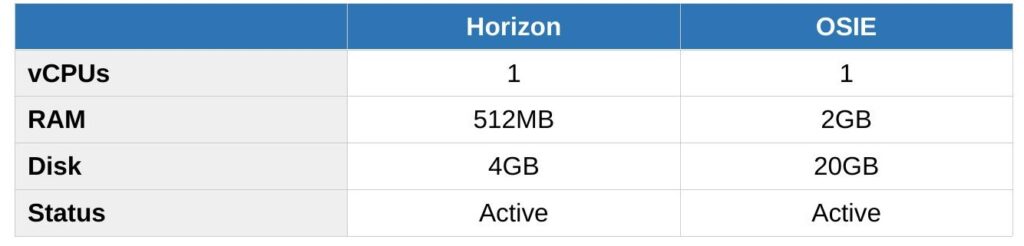
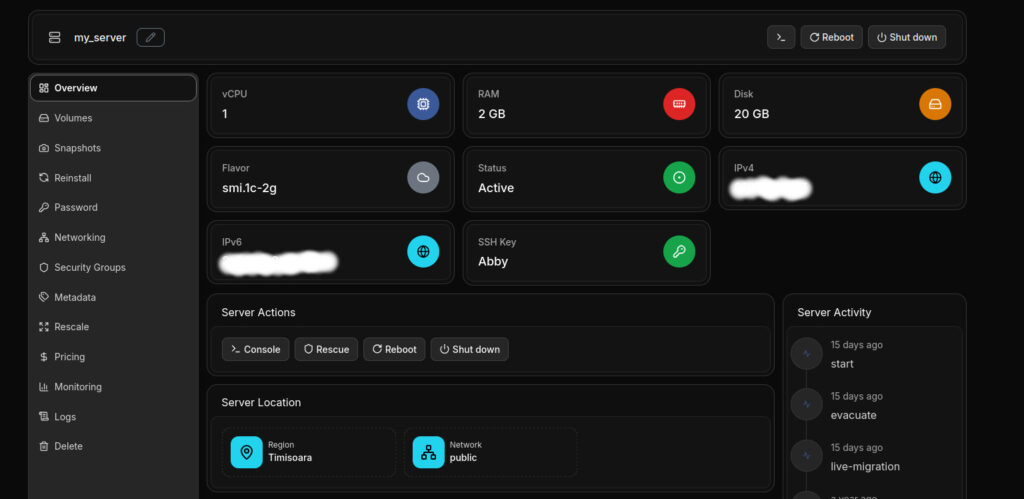
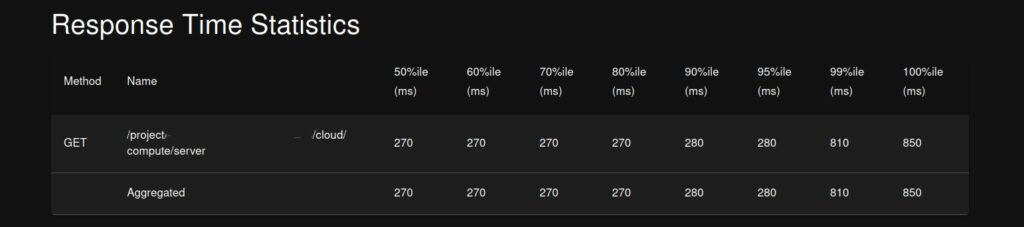
OSIE test instance: 1 server [my_server: 1 vCPU, 2GB RAM, 20GB disk], running on Osie, region Timisoara.
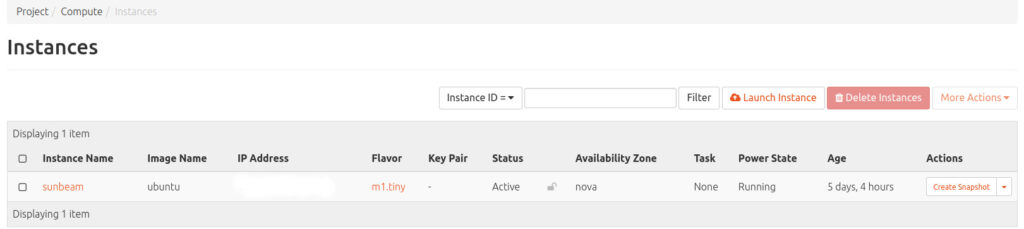
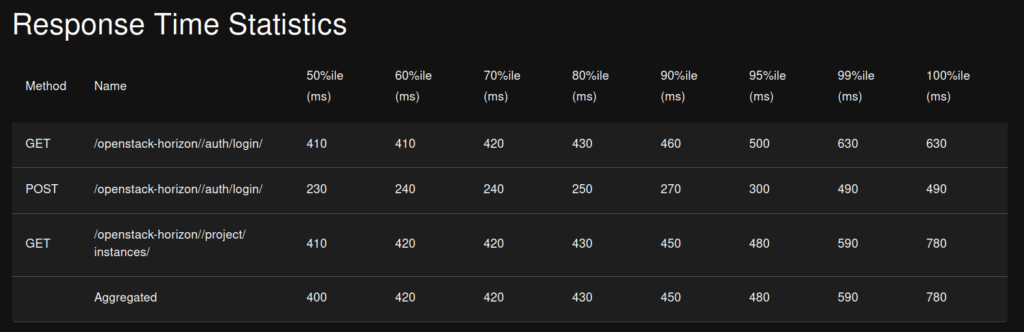
Horizon test environment: 1 instance [sunbeam: 1 vCPU, 512MB RAM, 4GB disk (Active)] , running on Canonical OpenStack (Sunbeam deployment).
The Osie instances page was loaded once before the test to obtain an authentication token. This means the cache was already warm at test start.
This reflects real-world usage, where a user logs in before interacting with the dashboard. Horizon has no equivalent caching layer, so its results represent cold responses on every request.
The Results: 100 Concurrent Users
For the first test, we stress-tested each dashboard, 1 instance each, for about 90 seconds, with 100 concurrent users and a ramp-up of 5 users per second.
Osie was 34% faster at median response time and 42% faster at the 95th percentile, meaning 95% of users got responses faster.
The 99th percentile favours Horizon slightly. Osie had occasional outlier spikes, likely cache misses or token refresh.
Both handled the same load with zero failures.
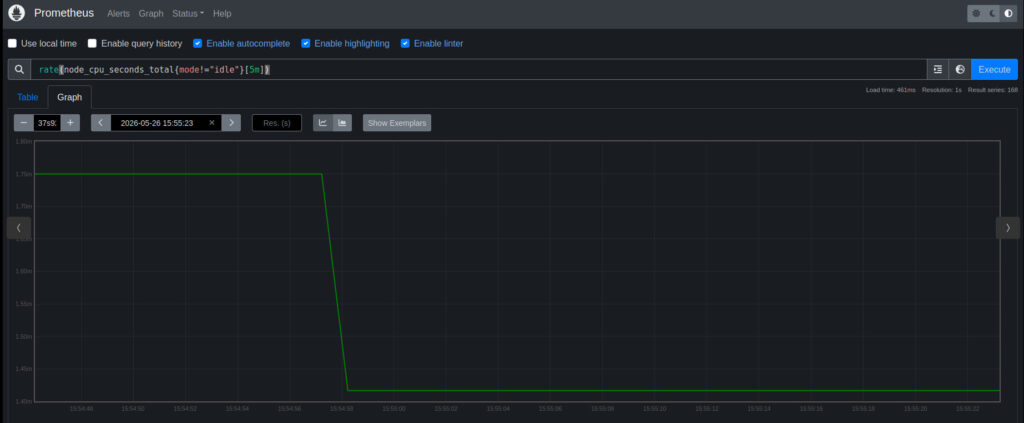
It’s Not the Hardware
CPU utilization on the OpenStack controller remained consistently low throughout the 100-user Horizon load test.
How does Horizon measure up against Osie in production?
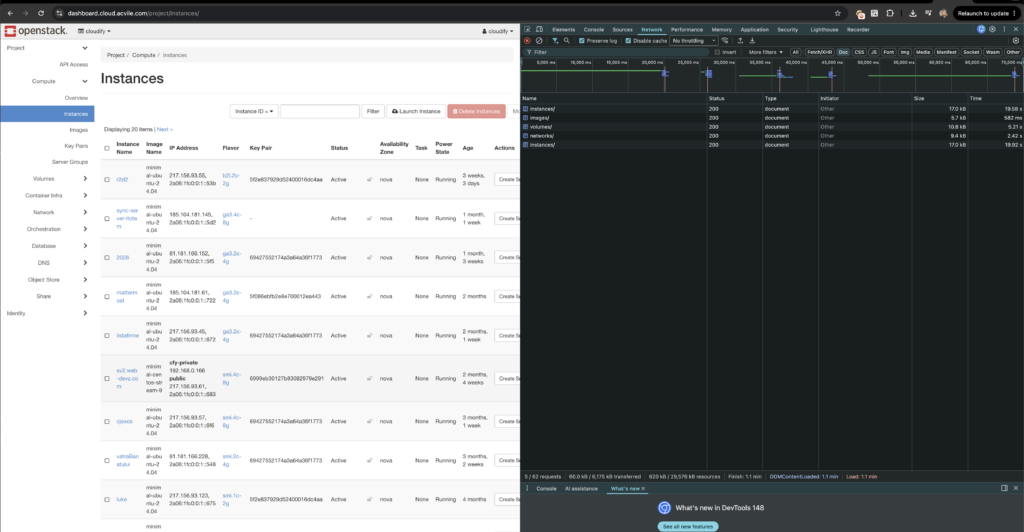
Real-World Scale: Horizon vs Osie in Production
Horizon loaded 40 instances, 10-20+ networks, volumes, security groups, and images. The Instances page took 19.58 seconds to load. Total page load: 70 seconds.
Not because the server was slow. Because Horizon makes sequential API calls.
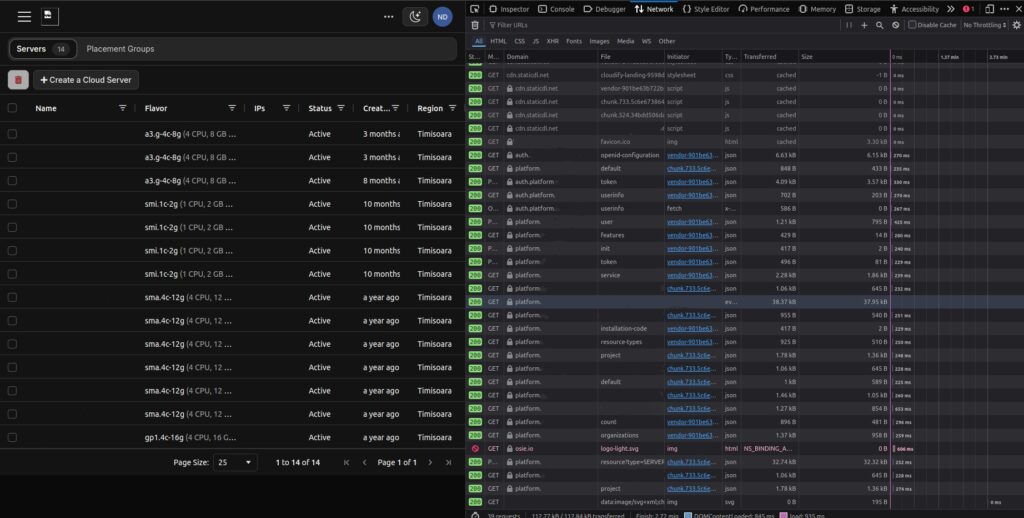
On the other side was Osie. A production environment with 14 servers, same Timisoara region. The DOM loaded in 845ms.
Osie didn’t wait for one call to finish before starting the next.
The Bottom Line
At 100 concurrent users, Osie was 34% faster at median response time and 42% faster at the 95th percentile.
At production scale, Osie loaded 14 servers in 845ms. Horizon took 19.58 seconds for the Instances page to load.
The gap only widens from here.
Conclusion
If you’re migrating from VMware to OpenStack, you don’t need to build a custom dashboard for your customers and staff.
Osie extends OpenStack Horizon to give you a UI with enterprise-grade features.
With Osie, your dashboard will perform at scale. The data has proven it.
Ready to see Osie in action? Schedule a Demo
Download the PDF with all the data.